A theme of previous ToWs has been that applications often have lots more functionality than users either know or care about enough to utilise. Two of the simplest yet most impactful ways of handling data in Excel (and in Google Sheets, LibreOffice / OpenOffice etc, which basically copied the functionality) is to create tables from data, and to use conditional formatting to help them stand out.
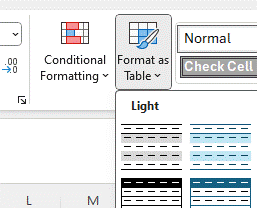
Select a block of data – and for the purposes of these examples, we’re going to use some sample sales data – and on the home tab, it’s a few clicks to Format as Table. Even if you don’t intend to use more advanced formulae and get into naming tables and ranges, just doing the simple formatting and declaring the top row as headers gives you great ability to sort and filter the data quickly.
If you’re lucky, the table may automatically interpret the contents of your data, too – like understanding date fields. As we’ll get to later, you can even sort and filter by the appearance and not just the actual contents.
Users working on data in Excel which is clearly tabular but has not been defined as a Table, should almost be considered criminals.
Conditional Formatting made easy
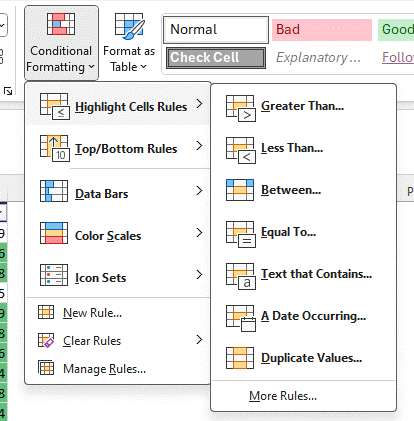
Back on the Ribbon, the neighbouring Conditional Formatting control lets you add more pop to an existing Table or any other data. Select whatever cells, columns or rows you want to apply it to, and on the flyout menu you’ll have access to hundreds of options to visually distinguish certain data.
For simple “how to” and a cheesy video, check out the help on Use conditional formatting to highlight information in Excel.
If you need to do stuff that’s more complex, there’s also the option to write a formula but it’s quite different to regular Excel formulae – and can take a bit of working out, especially if it’s more complex. See the “Use a formula…” further down that previous help page.
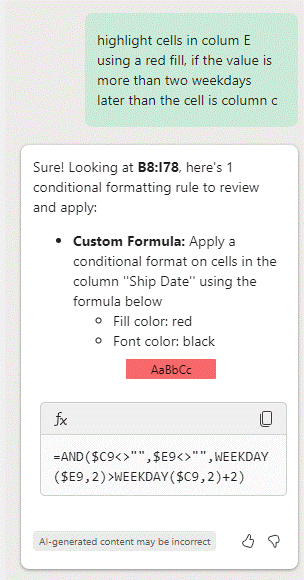
Fortunately, there’s an easier way if you’re a Copilot user (and if you’re not, Microsoft has started pushing a free 1-month trial – just make sure you put a reminder in your diary or you’ll fall into the trap of subscribing to stuff you might not want). Rather than trying to write a formula and figure out the logic of it, you can just ask Copilot and it will comply…
After it has been applied, you could edit the rule to change its range, tweak the formula or adjust the formatting by going to the Manage Rules option under the Conditional Formatting menu. Make sure the “Show formatting rules for:” filter is set to the right area so you’ll see this and any other rules which may apply.
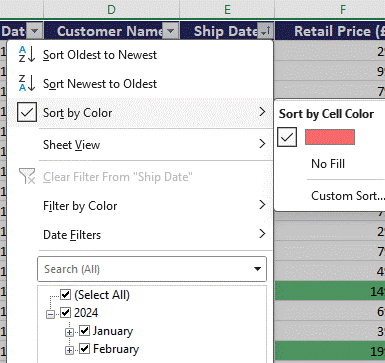
These rules are very useful for highlighting things that stick out – like due date on a pipeline report which have now passed, or a number that’s radically out of kilter with all the others in an export from a credit card account. If you’re dealing with very large sheets of data, you could filter the view not just by the values but by the colours that your formatting has set:
… thus temporarily hiding any of the rows which are not of interest.
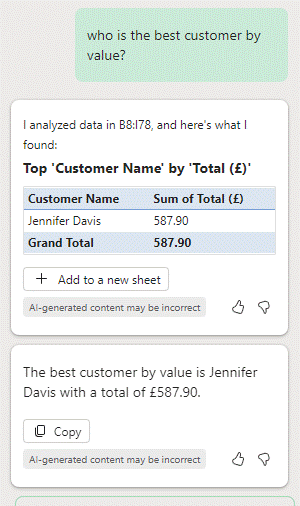
Finally, you can interrogate data within Copilot without having to mess about with filters and the like, for example:
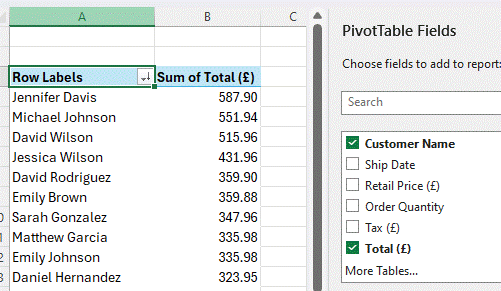
To validate that this is actually true, a pivot table can show the data by different dimensions and allow totalling, sorting and filtering: in this case, sorting (descending) by the sum of all orders:
Pivot Tables are some of the best magic that Excel delivers; it’s been a while since they’ve featured in ToW – leave a comment if you think that needs addressing. See here for more examples of Copilot prompts in Excel.

