|
 PowerPoint files can get big. In the scale of small vs large, sending a many-megabyte PPT file around between a few people might not matter much, but if you’re building a presentation that is going to be widely shared, it could cost actual money – data storage costs, bandwidth charges on a website, carbon footprint for transmitting and storing etc. PowerPoint files can get big. In the scale of small vs large, sending a many-megabyte PPT file around between a few people might not matter much, but if you’re building a presentation that is going to be widely shared, it could cost actual money – data storage costs, bandwidth charges on a website, carbon footprint for transmitting and storing etc.
Estimates of the energy cost to transmit and store data vary wildly, but if 1 GB cost 1 kWh power and the average CO2 output for generation was ~500g/kWh, then even shaving 10MB off a file can make a material difference if it’s going to be heavily used†.
There are a few tricks you can follow to make your PPTs less massive – like compressing the images within, meaning that an embedded picture which was originally sized to print on a poster could be re-sized to fit on a screen.
 If you see a few-slide presentation file and it’s dozens of MB in size, then there’s probably other info in the deck which is not necessary for your presentation. Even more likely is that there are some embedded graphic or video assets which are bloating the size of it. Quickly identifying the cause of such largesse might allow you to ditch the offending slide or resize/remove the content. If you see a few-slide presentation file and it’s dozens of MB in size, then there’s probably other info in the deck which is not necessary for your presentation. Even more likely is that there are some embedded graphic or video assets which are bloating the size of it. Quickly identifying the cause of such largesse might allow you to ditch the offending slide or resize/remove the content.
A somewhat cavalier way of looking for large things you can torch, is to make a copy of your PPTX file and then rename it so you can look within. The OfficeXML file formats (prevalent in Office 2007 and onwards) use the same compression as ZIP files, so if you rename your file as such, you’ll be able to open it in Windows Explorer or other ZIP handling utilities, to see its innards. Opening the file shows you a folder structure, and if you navigate into ppt \ media then sort by Size, you’ll quickly see what’s making your file so big.
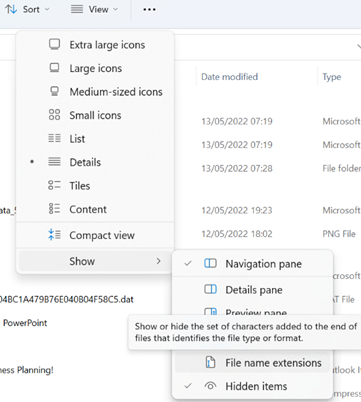 Actually doing the rename might be trickier than you think, since Windows hides by default such grubby detail as file extensions. One trick is to flip the switch to show extensions again (in Windows Explorer, look under View menu / Show / File name extensions), then it’s a simple matter of changing the file in Explorer by editing the last part of its name from .pptx to .zip. Actually doing the rename might be trickier than you think, since Windows hides by default such grubby detail as file extensions. One trick is to flip the switch to show extensions again (in Windows Explorer, look under View menu / Show / File name extensions), then it’s a simple matter of changing the file in Explorer by editing the last part of its name from .pptx to .zip.
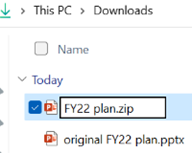 Once you’ve confirmed in the warning dialog that the apocalypse is nigh and you really do want to change file type, open the new ZIP file and you’re off. Remember to go back in and switch off the Show > File name extensions option if you’re so inclined. Once you’ve confirmed in the warning dialog that the apocalypse is nigh and you really do want to change file type, open the new ZIP file and you’re off. Remember to go back in and switch off the Show > File name extensions option if you’re so inclined.
 If you’re still unsure about these new-fangled “gooey” interfaces, you could crack open the command line to do it quickly. If you’re still unsure about these new-fangled “gooey” interfaces, you could crack open the command line to do it quickly.
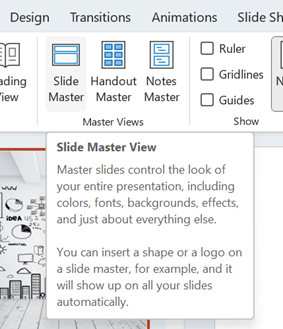 If all this grubbing about inside PowerPoint files makes you feel uneasy, there is one other trick that could yield dividends – look inside the Master. Since many people create a new presentation by starting with an old one, they liked, it’s very possible there are slide layout templates with embedded graphics that you no longer need – especially if the originating deck was produced for a conference. If all this grubbing about inside PowerPoint files makes you feel uneasy, there is one other trick that could yield dividends – look inside the Master. Since many people create a new presentation by starting with an old one, they liked, it’s very possible there are slide layout templates with embedded graphics that you no longer need – especially if the originating deck was produced for a conference.
Go into View menu and look under Slide Master, which will open a whole new tab specific to the management of these template slides that form the bones of the presentation. You may well see lots of title slides or similar, which have embedded background images – if you know you don’t need those graphics or those layouts, just delete them.
 PowerPoint generally won’t let you ditch a master layout which is being used to format the current slide deck; so, if you have your deck already built and want to distribute it, just go into the Slide Master view, delete everything which looks unnecessary and that PowerPoint will allow you to, then Close the Master view to return to the main menu. Once you’ve checked that the presentation format hasn’t been garbled, go File > Save As and give it a new name. Now compare the size of the new and old files. PowerPoint generally won’t let you ditch a master layout which is being used to format the current slide deck; so, if you have your deck already built and want to distribute it, just go into the Slide Master view, delete everything which looks unnecessary and that PowerPoint will allow you to, then Close the Master view to return to the main menu. Once you’ve checked that the presentation format hasn’t been garbled, go File > Save As and give it a new name. Now compare the size of the new and old files.

This title slide in the Slide Master view had a graphical background which was 17Mb in size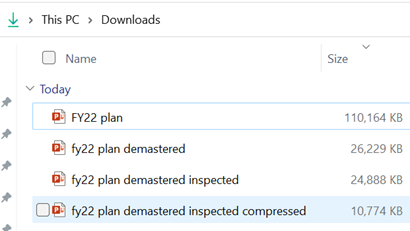 ; just deleting all the unnecessary visual slide templates dropped the size of the original file from 110MB to 26MB. ; just deleting all the unnecessary visual slide templates dropped the size of the original file from 110MB to 26MB.
 Running the Document Inspector to remove other content further dropped another 1.5MB. Running the Document Inspector to remove other content further dropped another 1.5MB.
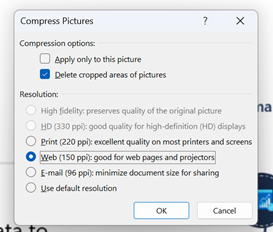
Selecting an image from one of the 70-odd slides in the deck, and choosing Compress Pictures from the Picture Format tab reduced it again to only 11MB, or 10% of the original file size – all for a few minutes’ effort.
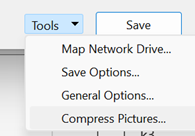 Going back to the original 110MB file and opening File > Save As, then choosing More options… will open a traditional Save As dialog box; on the bottom is a Tools > submenu which allows you to run the Compress Pictures function at the point of saving the file, so reducing it to 1/3 of the original size, for literally 15 seconds’ work. Going back to the original 110MB file and opening File > Save As, then choosing More options… will open a traditional Save As dialog box; on the bottom is a Tools > submenu which allows you to run the Compress Pictures function at the point of saving the file, so reducing it to 1/3 of the original size, for literally 15 seconds’ work.
†NB: the irony of sending a 2MB email to thousands of people, and sharing online and on LinkedIn, is not lost.
|

